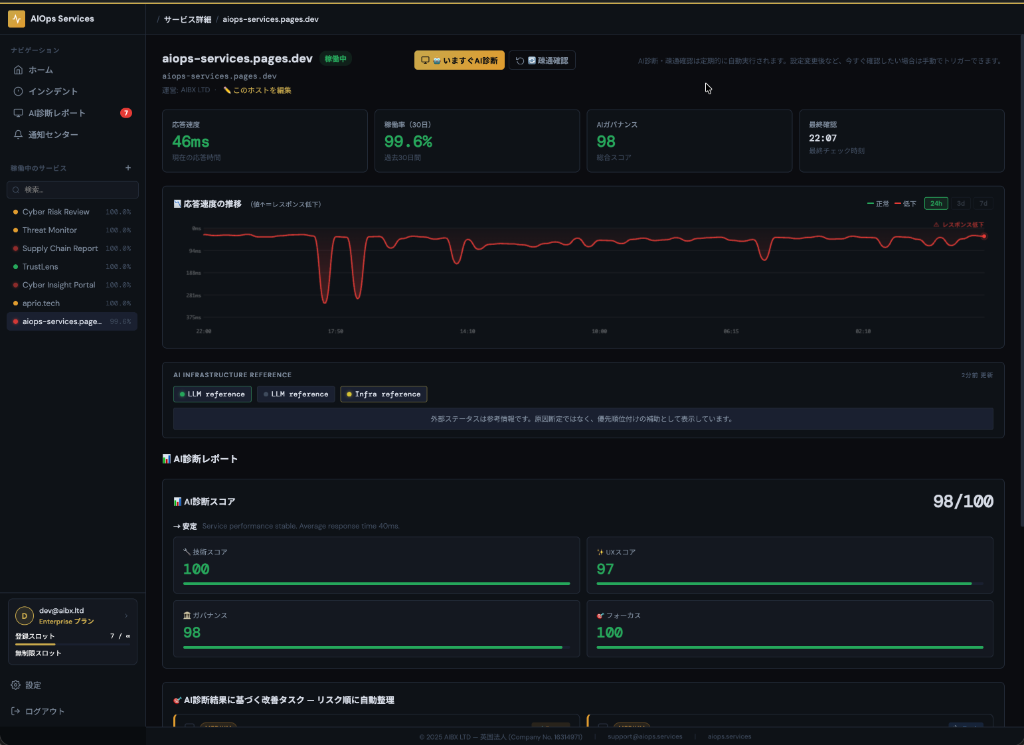
Run post-launch operations without a dedicated engineer

Make post-launch AI service operations sustainable with a small team.

Add a URL and automate outage detection, prioritization, and remediation guidance.
From detecting response changes to narrowing likely causes and preparing remediation instructions, the workflow reduces slow detection and uncertainty around what to fix first.

Free up to 5 hosts / No credit card required /
Built for public-facing services / Works alongside existing AI tools
Continuously monitor HTTP response, latency, and page availability for public URLs AI suggests likely causes and prioritizes what to review first Generate remediation guidance ready to pass into Cursor, Claude, and similar tools

There are other tools for simple uptime checks.
AIOps Services automates what comes after monitoring.

The difference is that it goes beyond alerts, connecting observed data to AI diagnosis and the next actions in one workflow. It reduces the need to re-explain the situation from scratch every time you open an LLM.

Capability External monitoring tools General-purpose LLMs AIOps Services
Continuous uptime and latency monitoring
Continuous SSL and public-state monitoring
AI-based first-pass cause estimation △ Requires manual prompting ✅ Automatic
Prioritized remediation suggestions △ Possible with prompting
Cross-service operational visibility
Immediate remediation guidance generation △ Requires prompt drafting

From monitoring to remediation guidance, in one workflow

Go beyond “monitoring only” or “advice only” by connecting the three phases needed for post-launch operations, with a clearer example of what the AI output actually looks like.

Monitor
Monitor screenshot

See uptime, latency, and abnormal signals across services in one view

Continuously monitor the external state of public URLs. Track response-time changes, rendering status, and public SSL signals automatically so early warning signs are easier to catch.

It also makes “not fully down, but getting slower” situations visible early, even when it is unclear where to start investigating.

Analyze
Analyze screenshot

When anomalies are detected, AI estimates likely causes and organizes priority

Based on degraded responses and changes in public state, the system surfaces what to check first with priority. It does not stop at alerts — it makes the next review step clearer.

Example: response time 847 ms (4.2× normal) / Priority: High / Suspected issues: slow authentication route, missing security headers.

Resolve
Resolve screenshot

Automatically generate remediation instructions with the right context

Use the generated remediation guidance directly in your existing AI tools. Start fixing sooner without having to restate the full situation from scratch.

Pass the generated guidance into Cursor, Claude, ChatGPT, and similar tools to connect directly into your remediation workflow.

What AI diagnosis and remediation output looks like

Instead of stopping at alerts, the page clarifies what changed, what to inspect first, and how to hand the context into your remediation workflow.

Example output
🔍 Detection

https://api.example.com/auth responded in 847 ms (4.2× normal baseline)

📋 AI diagnosis

Response degradation was detected after a recent change. The output highlights the authentication route, config drift, and security-header deltas as first checks.

⚠️ Priority

High — the issue may affect authentication or other critical paths, so it is ranked as an immediate review item.

🛠 Example remediation prompt to copy into AI tools
"Authentication API latency has spiked. Review recent changes, worker / app configuration, and bottleneck candidates on the /api/auth route, then summarize reproducibility and rollback options."

Add a URL, then let AIOps take it from there

From adding a URL to change detection, AI triage, and remediation actions, the flow is designed to stay low-friction.

1️⃣ Add the URL to monitor

Enter a service name and URL to start scheduled monitoring. The initial status check is available right away.

2️⃣ AI detects and analyzes changes

Continuously monitor latency, public-state changes, and governance shifts. When anomalies appear, AI performs first-pass triage and prioritization.

3️⃣ Get remediation guidance and respond

Use the generated guidance directly in your existing AI tools and development workflows. Higher plans also support API and MCP integration.

Comic illustration showing the AIOps Services workflow

Use cases by persona

Designed for AI coders, new-business teams, and small operating teams facing different post-launch operational pain points.

AI coders / vibe coders

Well suited for people who want to quickly catch “it works, but it is slow, unstable, or suspicious after the latest deploy” and hand off a structured starting point to AI.

AI product / BizDev teams

For teams that do not have a dedicated operator but still need to keep first-line monitoring running after launch. It reduces missed issues and slow prioritization.

Solo developers

A good fit when you are operating alongside a day job or other client work and want one place for anomaly detection, prioritization, and remediation guidance.

Automate operations from £39/month before hiring more operators

The plan structure stays the same, with clearer guidance on which teams each tier fits. Prices are based in GBP and JPY values are approximate conversions so budget review is easier.

FREE

For individuals and side projects
£0
Approx. ¥0
  • 5 hosts
  • Automated AI diagnosis and connectivity checks
  • Remediation prompts and basic alerts

STARTER

For freelancers and solo founders
£39
Approx. ¥7,900 / month
  • 15 hosts
  • Automated and manual AI diagnosis
  • Public/private visibility switching
  • Everything in FREE

SCALE

For teams operating multiple products
£299
Approx. ¥59,800 / month
  • 200 hosts
  • Full API integration
  • Slack notifications
  • Everything in GROWTH

ENTERPRISE

For custom requirements and large-scale operations
£799
Approx. ¥159,800 / month
  • Unlimited hosts
  • Custom policy packs
  • Advanced automation flows
  • Everything in SCALE

Prices are based in GBP. JPY values are shown only as approximate conversions. Please confirm the final charged amount in Stripe Checkout.

Security and data handling

Monitoring scope

  • Monitoring covers public HTTP/HTTPS responses, latency, page availability, external status references, and publicly observable SSL-related information.
  • It does not directly access internal APIs, authenticated areas, source code, or databases.

Inputs used for AI diagnosis

  • AI diagnosis performs first-pass triage based on externally observable monitoring results and related metadata.
  • Generated remediation guidance is formatted so it is easy to pass into existing AI tools and development workflows.

Alerts and integrations

  • Basic alerts are supported.
  • Higher plans expand access to Slack notifications, webhooks, and API / MCP integrations. See plan details for scope.
Research

Why external monitoring helps prevent major incidents

Our research suggests that continuous external monitoring can help surface early warning signs before major incidents and market penalties. Visit the research page for the supporting rationale and figures.

View research details

FAQ

Answers to common questions.

What do you monitor?

Public HTTP/HTTPS responses, latency, page availability, and external status references for public URLs. Internal APIs and authenticated areas are not accessed.

How often do you check?

The FREE plan currently operates around a 5-minute interval for scheduled checks. Please confirm detailed settings and future configuration flexibility based on your plan and setup.

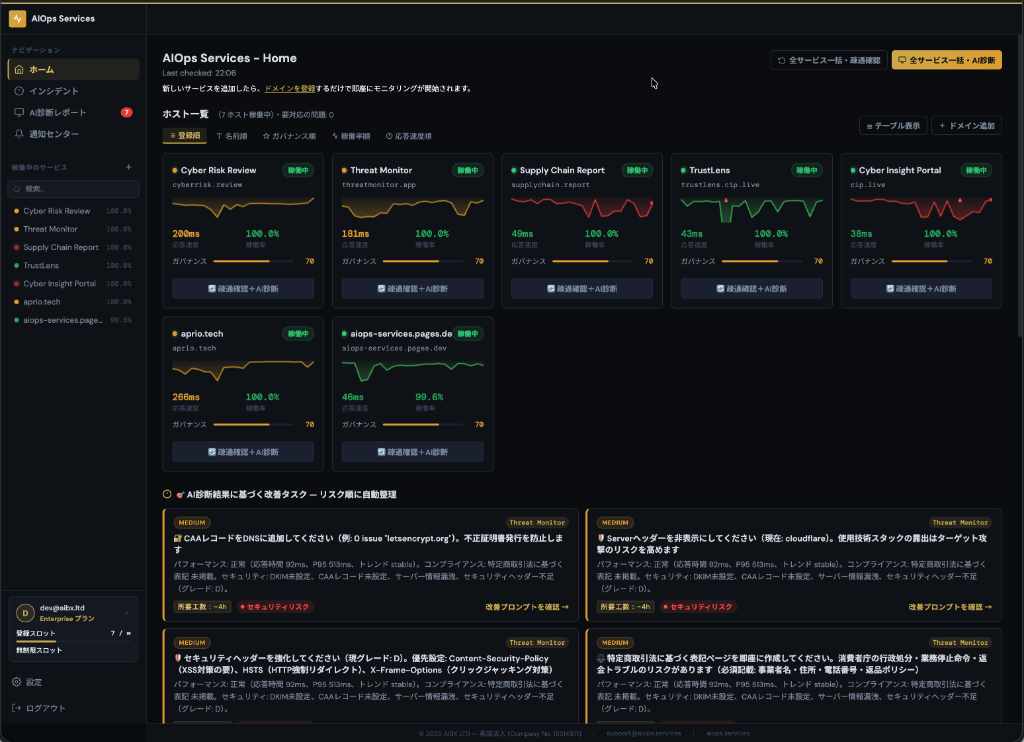
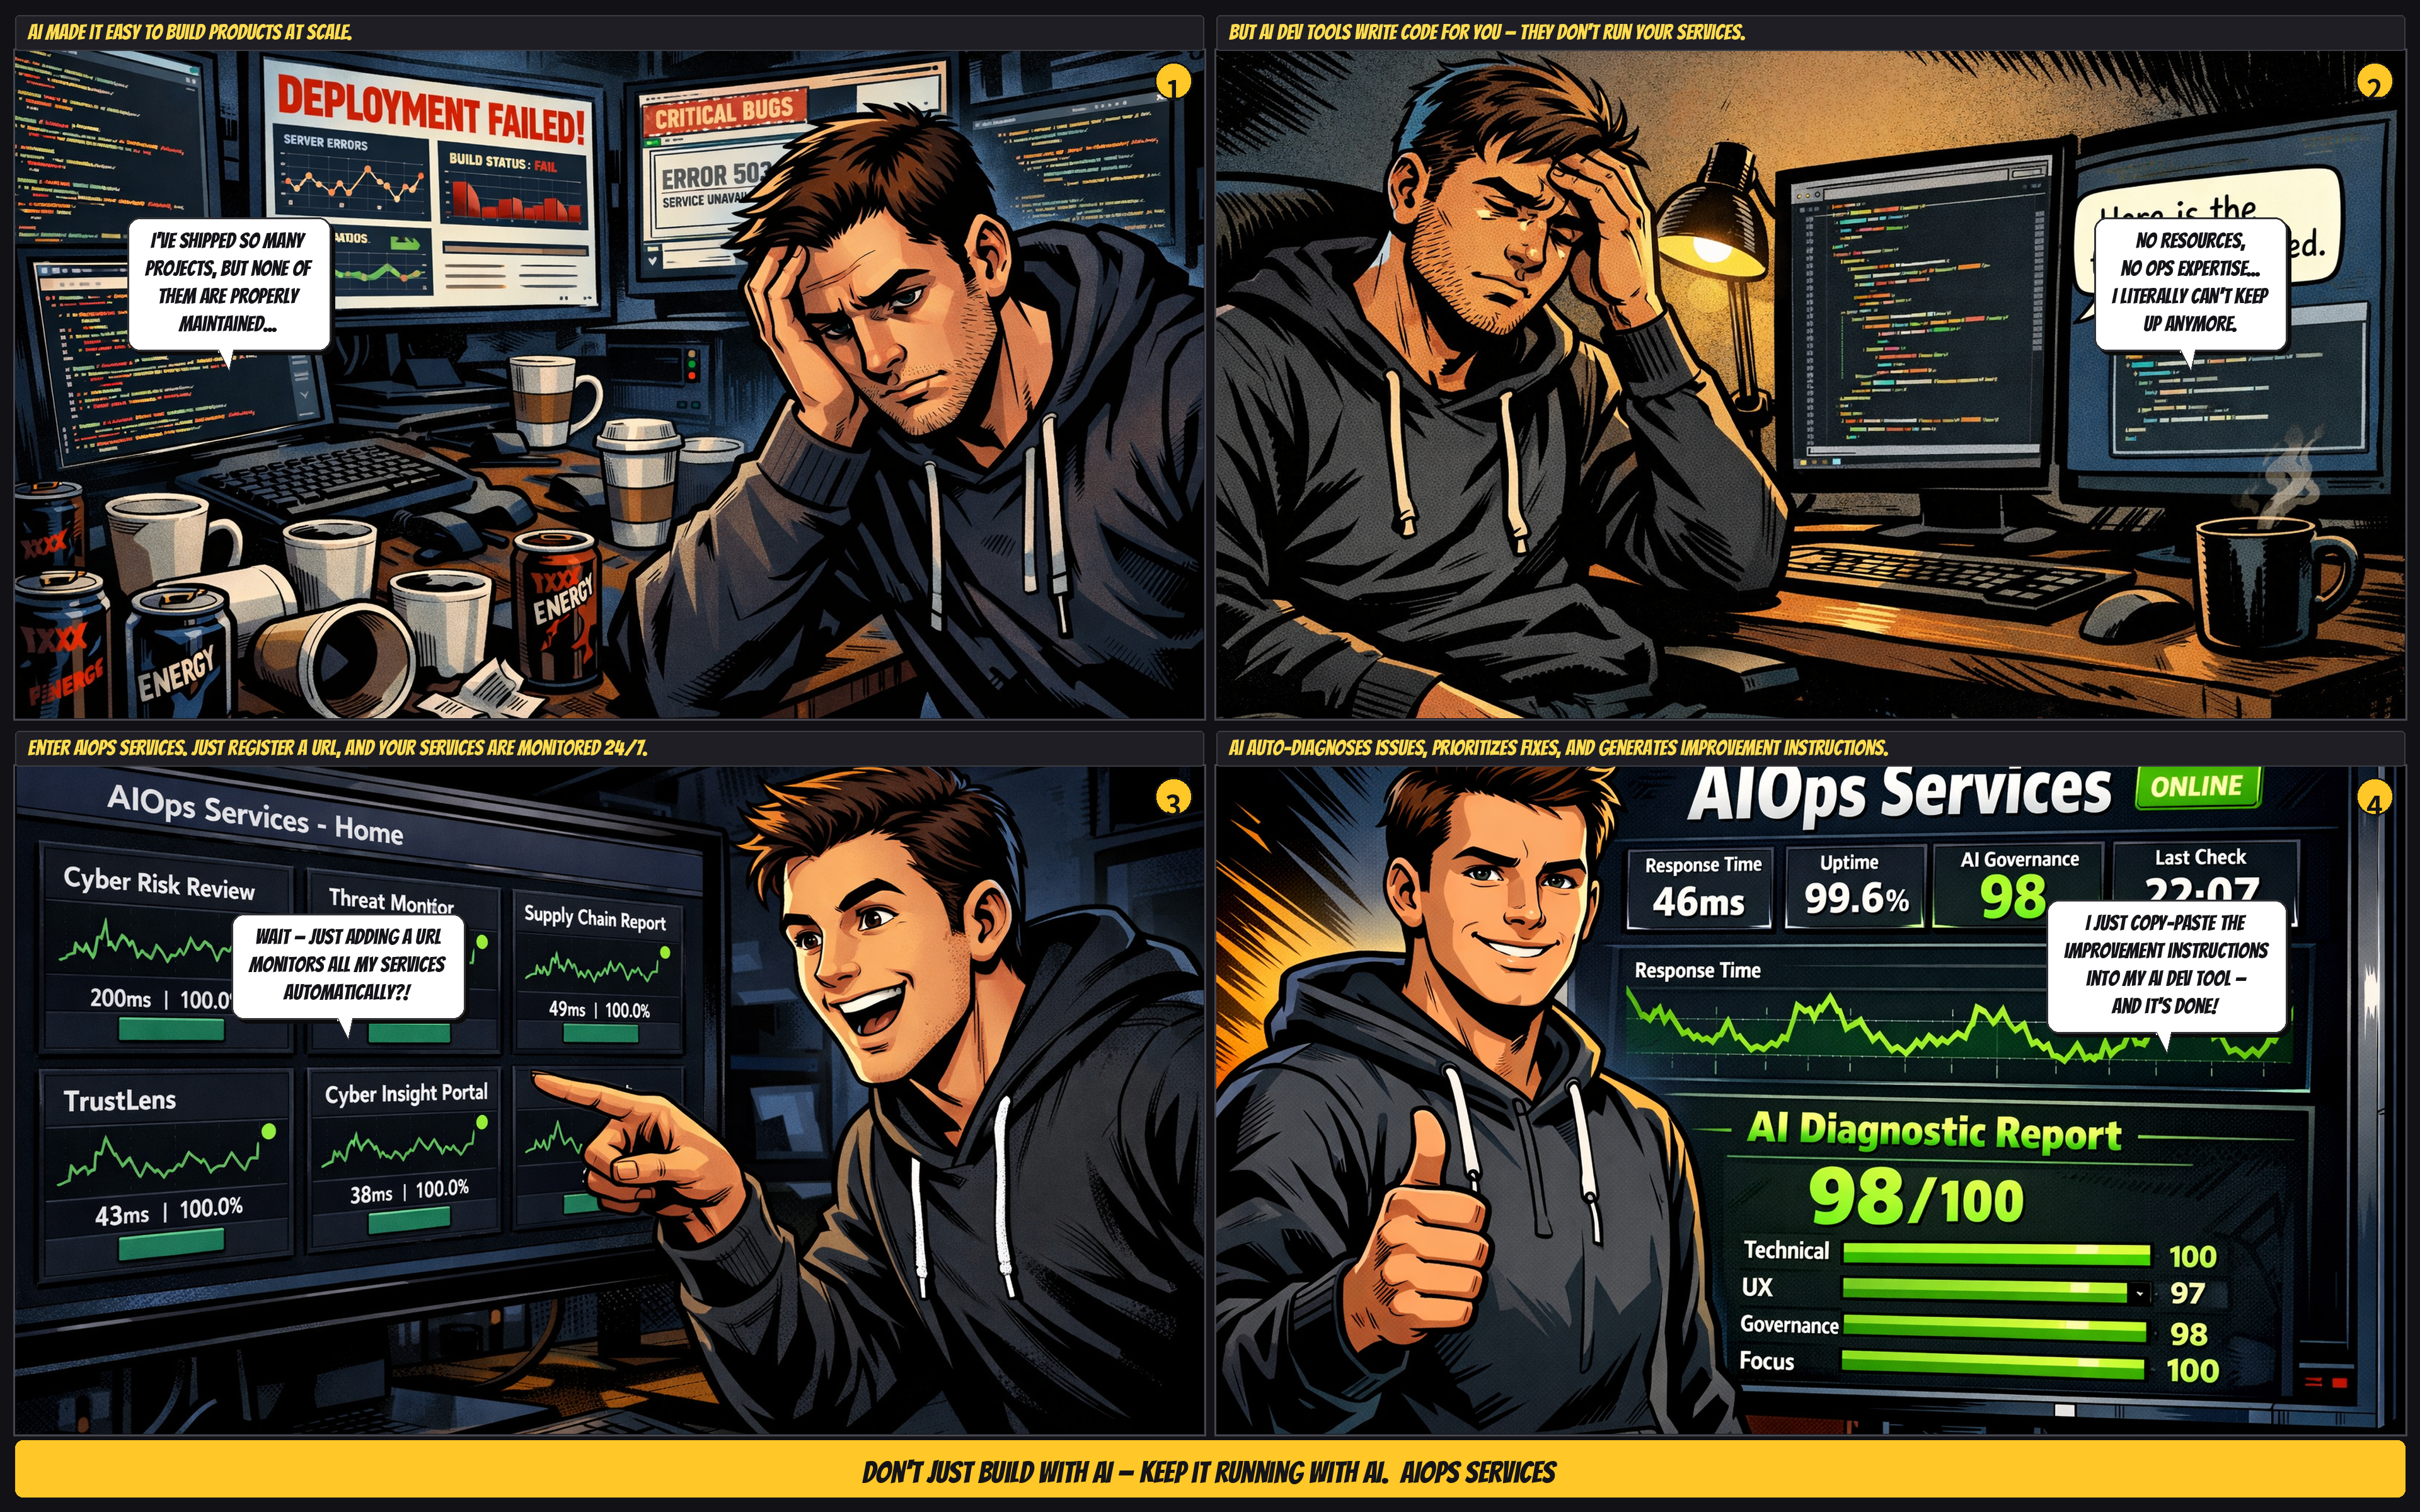
How is this different from UptimeRobot or Pingdom?

It goes beyond notifications by connecting monitoring to AI-based first-pass triage and prioritized remediation guidance.

Is a general-purpose LLM like ChatGPT enough?

General-purpose LLMs are useful as advisors, but continuous monitoring, change detection, and cross-service visibility still need to be handled separately. AIOps Services covers that operational front end.

How should AI diagnosis be used?

AI diagnosis is a first-pass triage layer that proposes likely causes and remediation actions with priority. Final decisions should still be made using measured data and the real production environment.

Which AI tools can this work with?

Remediation guidance is easy to pass into tools such as Cursor, Claude, and ChatGPT. Higher plans are also designed with API and MCP integration in mind.

What alert channels are available?

Basic alerts are supported, and higher tiers expand access to Slack notifications and webhook integrations. Please refer to plan details for scope.

Can you monitor internal APIs or authenticated URLs?

The monitoring scope focuses on public URL monitoring. It does not directly access internal APIs or authenticated areas.

Are the prices in JPY fixed?

No. They are approximate conversions from GBP. Please confirm the final charged amount in Stripe Checkout.

Where can I review the research background?

Use the “Research” menu at the top of the page, or visit /research.

Start by adding a public URL for free.

Free up to 5 hosts with no credit card required. AIOps Services helps you put the first steps of post-launch operations in place: notice issues, prioritize them, and move into remediation.