AIOps Live

公開URLを登録するだけで、 継続監視の起点を作れます。

Simply by registering a public URL, you can set up continuous monitoring.

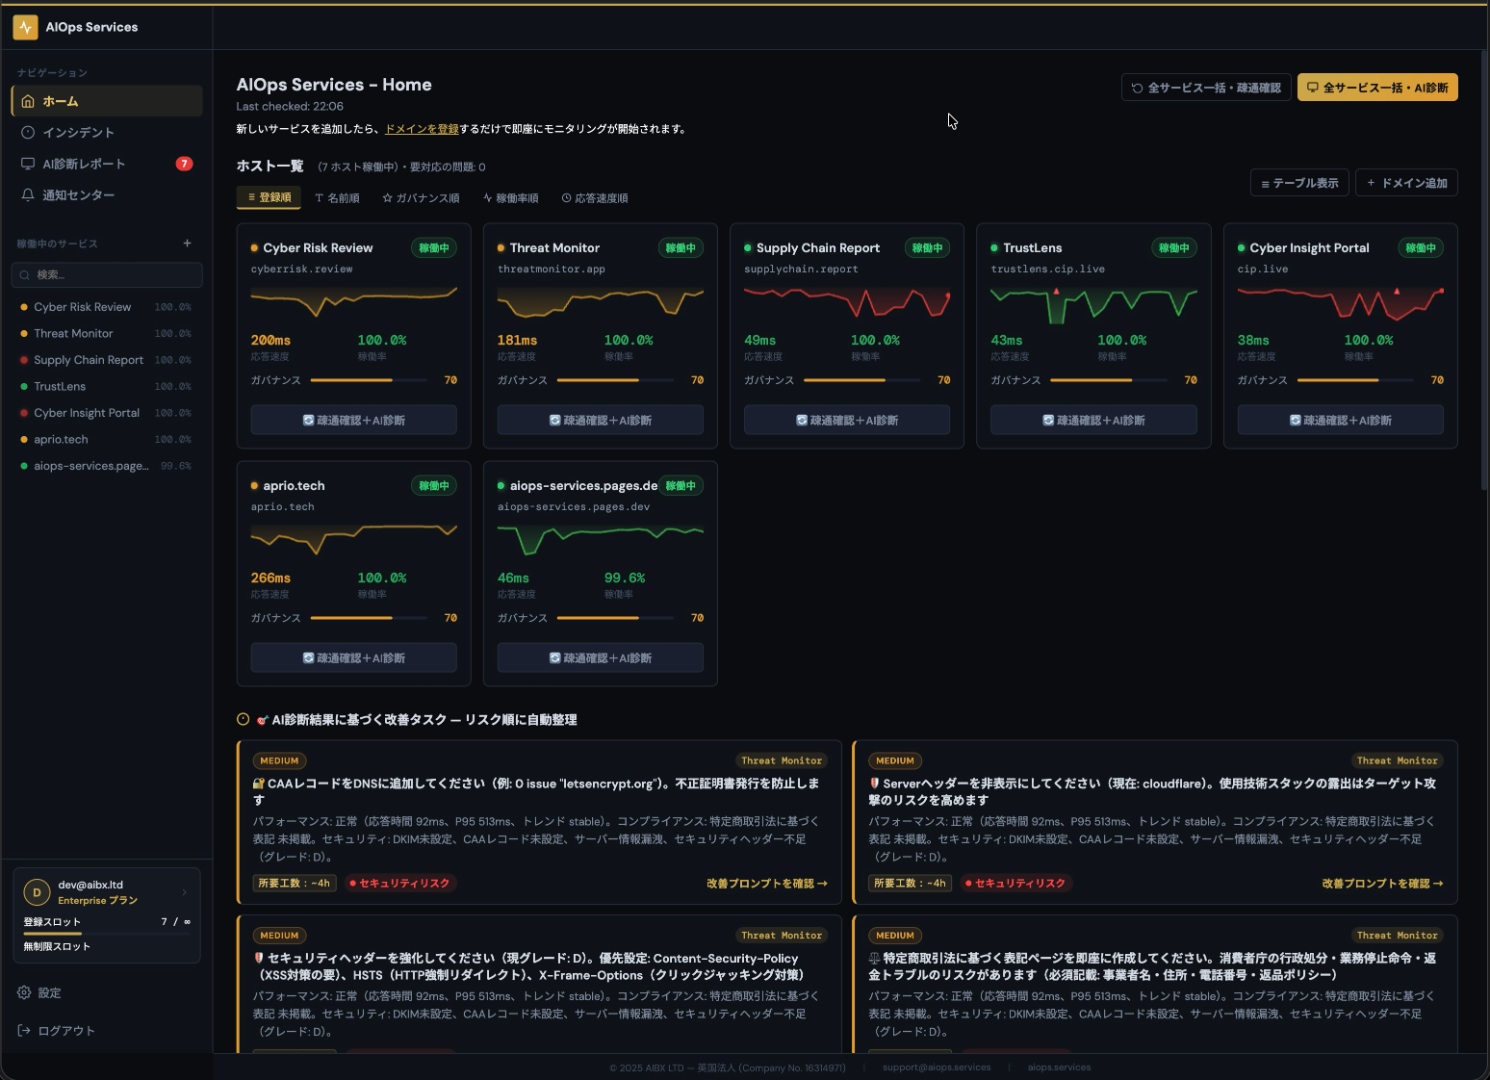
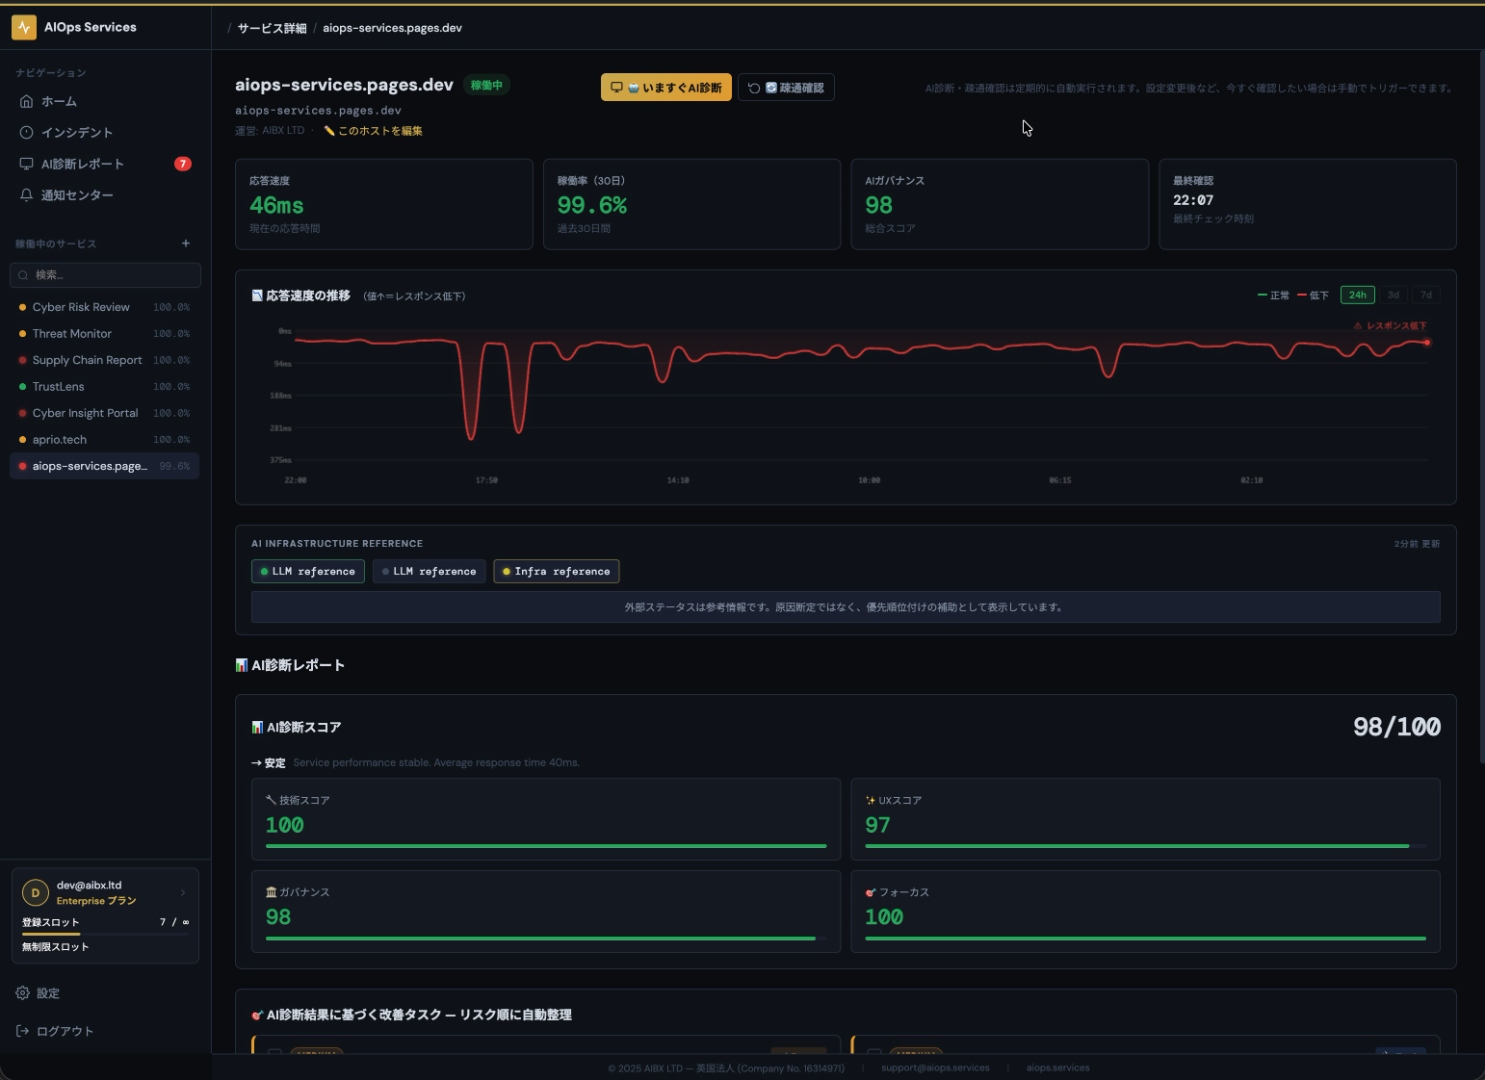
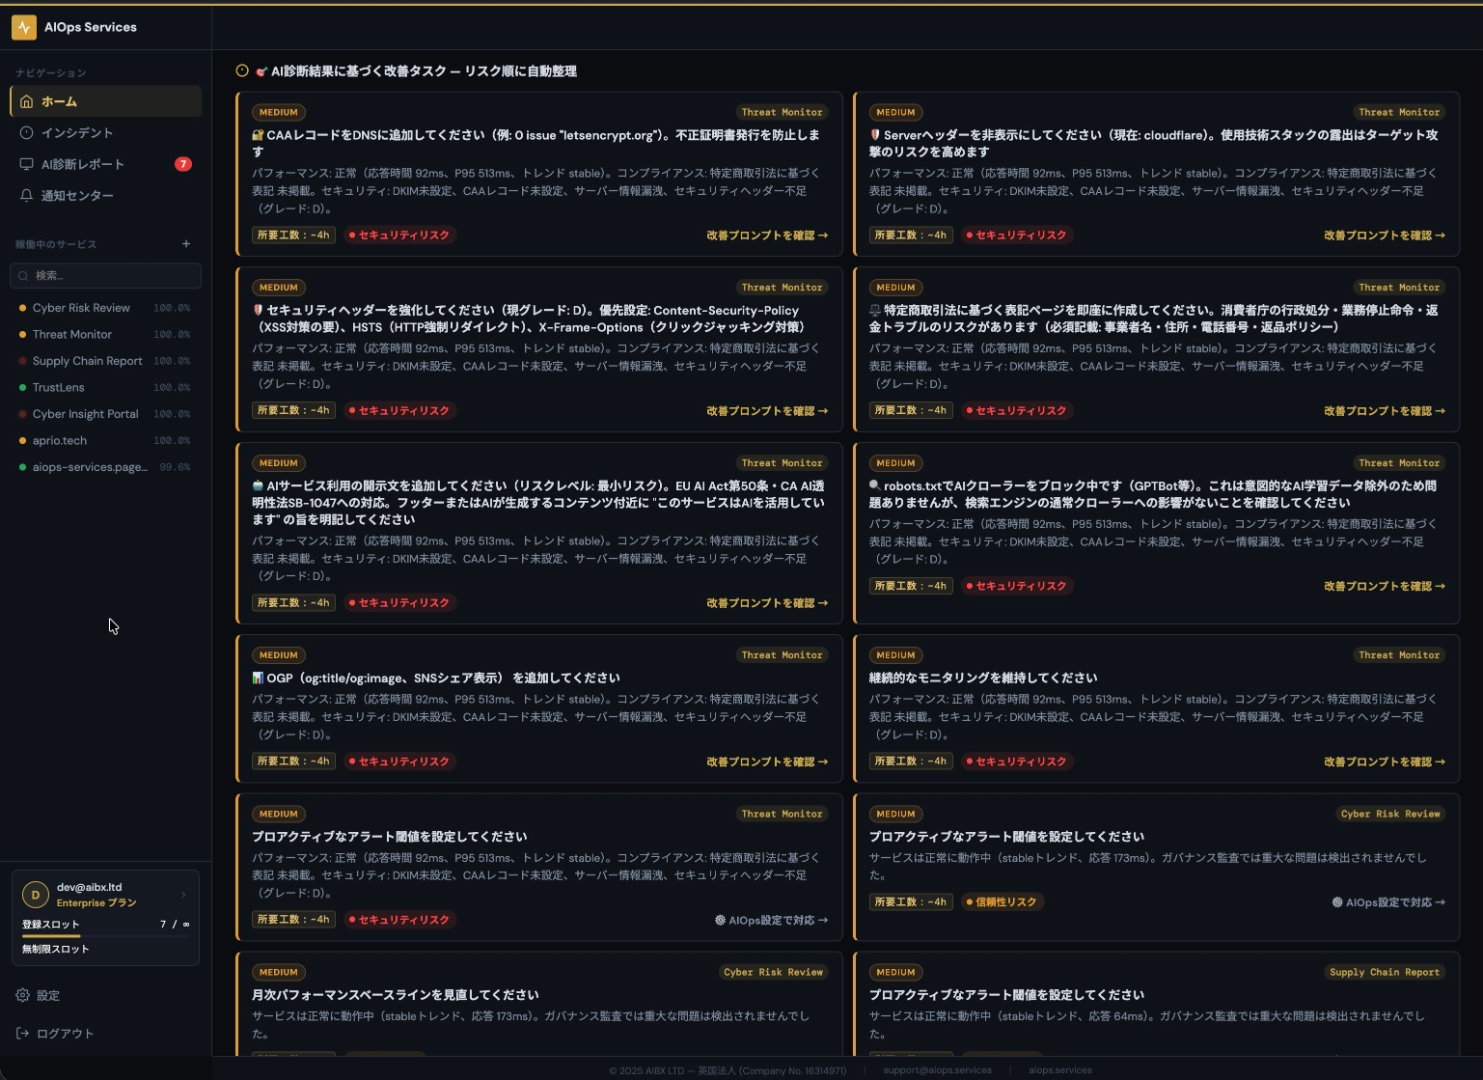
AIOps Live は、公開状態の変化を継続監視し、問題が起きた際には通知・優先順位・修正プロンプトを返します。 専任の運用チームがなくても、既存のAIツールと組み合わせながら、日常的な運用判断を進めやすくするための仕組みです。

AIOps Live continuously monitors changes in production status and, should an issue arise, provides notifications, prioritisation and prompts for resolution. It is a system designed to facilitate daily operational decision-making by integrating with existing AI tools, even without a dedicated operations team.

ドメイン登録だけで即時スタートInstant start with domain registration 24時間365日の自動監視24/7 automated monitoring 改善プロンプトを自動生成Auto-generated improvement prompts
AIOps Live の有償サブスクリプションをご購読いただくと、AIOps Rail および AIOps Claw を追加契約なしで無制限にご利用いただけます。Subscribe to any paid AIOps Live plan and get unlimited access to AIOps Rail and AIOps Claw at no extra cost. 1つのプランで、AIガバナンスに必要なインフラをすべてカバーします。One plan covers all the infrastructure you need for AI governance.

導入の流れはシンプルです。

The implementation process is straightforward.

AIOps Live の導入は3ステップ。ドメインを登録するだけで24時間365日のモニタリングが即時開始します。問題または予兆が検出されたら改善プロンプトが自動生成されるので、普段使いのAIツールにコピペするだけで対応完了。専門知識もエンジニアリングも不要です。

AIOps Live takes just 3 steps to set up.
Register your domain and 24/7 monitoring begins instantly.
When issues or early warnings are detected, improvement prompts are auto-generated —
just paste them into your AI tool and you're done.
No technical expertise or engineering required.

Step 1
AIOps Live Dashboard

ドメインを登録

Register Your Domain

サービス名と公開URLを登録すると、監視が始まります。Free プランでは公開スロット、Paid プランではホストごとの公開設定を管理できます。

Monitoring will begin once you have registered the service name and public URL. With the Free plan, you can manage public slots, whilst with the Paid plan, you can manage public settings on a per-host basis.

Step 2
AIOps Live Anomaly Detection

異常・予兆を自動検知

Auto-detect Anomalies & Early Warnings

応答速度・障害兆候・ガバナンス観点をまとめて確認し、優先順位をつけます。参考インフラ情報は、原因の断定とは分けて表示されます。

AIOps Live will review response times, signs of faults and governance considerations collectively and prioritise them. Reference infrastructure information is displayed separately from the determination of the cause.

Step 3
AIOps Live Improvement Prompt

改善プロンプトをAIにコピペ

Paste the Prompt into Your AI Tool

改善プロンプトは、お使いのAIツールへ貼り付けやすい形で返します。特定ツールへの依存を避け、既存の運用フローに組み込みやすくしています。

AIOps Live provide improvement prompts in a format that is easy to paste into your AI tool. This avoids reliance on specific tools and makes it easier to integrate into your existing workflows.

AIでプロダクト開発は量産できるようになった。

AI made it easy to build products at scale.

コマ1:デプロイ失敗に悩む開発者

でも、AI開発ツールはコードは書いてくれても、運用まではしてくれない。

But AI dev tools write code for you – they don't run your services.

コマ2:AIはコードを書くが運用はしない

そこで登場するのが、AIOps Services。URLを登録するだけで、サービスを24時間365日見守ってくれる。

Enter AIOps Services. Just register a URL, and your services are monitored 24/7.

コマ3:AIOps Servicesダッシュボードで監視

AIが原因を自動診断して、改善方針から対応の優先順位まで提示。改善指示も自動生成される。

AI auto-diagnoses issues, prioritizes fixes, and generates improvement instructions.

コマ4:AI診断レポートと改善指示

料金プラン

Pricing Plans

まずは Free プランで監視対象を登録し、どの程度の頻度で通知や診断が必要かを確認する使い方が適しています。 チーム共有・API・Slack連携・MCPガバナンスが必要になった段階で、上位プランへ移行できます。

We recommend starting with the Free plan to register your monitoring targets and assess how frequently you need notifications and diagnostics. Once you require team sharing, API access, Slack integration or MCP governance, you can upgrade to a higher-tier plan.

フリー

Free

£0
月額 ¥0
  • 5スロット
  • 5 slots
  • AI診断(月:10回まで)
  • AI diagnostics (up to 10/month)
  • Slack / Webhook alert
  • AI月次レポート
  • AI monthly report
今すぐ始めるGet Started

スターター

Starter

£39
概算月額 ¥7,900-Approx. (rate loading...)
  • 15スロット
  • 15 slots
  • AI診断(無制限 / 手動トリガー可)
  • AI diagnostics (unlimited / manual trigger)
  • Slack / Webhook alert
  • AI月次レポート
  • AI monthly report
今すぐ始めるGet Started

スケール

Scale

£299
概算月額 ¥59,800-Approx. (rate loading...)
  • 無制限スロット
  • Unlimited slots
  • AI診断(無制限 / 手動トリガー可)
  • AI diagnostics (unlimited / manual trigger)
  • Slack / Webhook / エクスポート
  • Slack / Webhook / Export
  • チーム共有 / 複数ワークスペース
  • Team sharing / multiple workspaces
  • 読み取りAPI / MCP Viewer
  • Read API / MCP Viewer
今すぐ始めるGet Started

エンタープライズ

Enterprise

£799
概算月額 ¥159,800-Approx. (rate loading...)
  • 無制限スロット
  • Unlimited slots
  • AI診断(無制限)
  • AI diagnostics (unlimited)
  • 優先SLA / 専任サポート
  • Priority SLA / dedicated support
  • Slack / Webhook / エクスポート
  • Slack / Webhook / Export
  • チーム共有 / 複数ワークスペース
  • Team sharing / multiple workspaces
  • フルAPI / MCP Viewer
  • Full API / MCP Viewer
今すぐ始めるGet Started

※日本円価格は本日レートでの概算価格です。請求通貨と最終金額は Stripe Checkout の表示をご確認ください。

※JPY prices are approximate based on today's exchange rate. Please refer to Stripe Checkout for the billing currency and final amount.

FAQ

よくある質問をまとめました。

Frequently asked questions.

サービス・監視Service & Monitoring
何を監視していますか?What does it monitor?

公開URLのHTTP/HTTPS応答、応答時間、表示状態、外部ステータス参照などです。内部APIや認証領域は取得しません。

Monitors public URL HTTP/HTTPS responses, response times, display status, and external status references. Internal APIs and authenticated areas are not accessed.

監視の頼度はどれくらいですか?How frequently does monitoring run?

FREEプランでは5分間隔の定期チェックを基準に運用しています。

The FREE plan runs checks on a 5-minute interval basis.

UptimeRobotやPingdomとの違いは何ですか?How is this different from UptimeRobot or Pingdom?

通知だけで終わらず、AIによる一次トリアージと優先順位付きの改善指示までつなげる点が違いです。

Unlike simple uptime tools, it goes beyond notifications to provide AI-driven triage and prioritised remediation instructions.

ダウン検知にかかる時間はどれくらいですか?How quickly is downtime detected?

チェック間隔の範囲内で検知します。FREEプランでは最大5分程度が目安です。

Detection occurs within the check interval. For the FREE plan, this is approximately 5 minutes at most.

内部APIや認証が必要なURLも監視できますか?Can internal APIs or authenticated URLs be monitored?

監視対象は公開URLの外形監視です。内部APIや認証領域への直接アクセスは行っていません。

Monitoring covers external checks of public URLs only. Direct access to internal APIs or authenticated areas is not performed.

AI・診断AI & Diagnostics
ChatGPTなどの汎用LLMだけでは足りませんか?Isn't a general-purpose LLM like ChatGPT enough?

汎用LLMは相談先として有用ですが、継続監視・変化検知・複数サービスの横断管理は別途必要です。

General-purpose LLMs are useful as consultants, but continuous monitoring, change detection, and cross-service management require dedicated infrastructure.

AI診断はどのように使うべきですか?How should I use the AI diagnostics?

AI診断は、原因推定と改善アクションを優先度付きで提示する一次トリアージです。最終判断は実測データと実環境を踏まえてください。

AI diagnostics provide first-level triage with prioritised root-cause estimates and remediation actions. Final decisions should be made by the developer.

AI診断の精度はどの程度ですか?How accurate is the AI diagnostics?

診断は観測データと既知パターンをもとに推論するものであり、正解率を保証するものではありません。

Diagnostics are inferences based on observed data and known patterns, and do not guarantee accuracy.

どのAIモデルを使用していますか?Which AI model is used?

利用するモデルはサービス構成により異なります。詳細はプラン仕様またはお問い合わせよりご確認ください。

The model used varies depending on the service configuration. For details, see the plan specs or contact us.

連携・通知Integrations & Notifications
どのAIツールと組み合わせられますか?Which AI tools can it be combined with?

改善指示はCursor・Claude・ChatGPTなどに渡しやすい形で活用できます。上位プランではAPI・MCP連携も可能です。

Remediation instructions are output in a format easy to pass to tools like Cursor, Claude, or ChatGPT.

アラートの通知手段は何がありますか?What alert notification methods are available?

基本アラートに対応し、上位プランではSlack通知やWebhook連携の範囲が広がります。

Basic alerts are supported. Higher plans expand the range of Slack notifications and Webhook integrations.

メール通知はありますか?Is email notification available?

アラートのメール通知はプランに応じて対応しています。

Email alert notifications are available depending on your plan.

AIツールにMCP設定を追加するにはどうすればいいですか?How do I add the MCP server to my AI tool?

AIツールごとに設定ファイルや画面が異なります。ChatGPT は Settings → Connectors / MCP、Claude Desktop は claude_desktop_config.json、Claude.ai は Account settings → Connectors、Cursor は cursor_mcp_config.json、Cline / Roo Code は mcpServers、Windsurf は mcp_config.json、Amazon Q Developer は ~/.aws/amazonq/mcp.json、Continue は .continue/mcpServers/mcp.json、Genspark は 設定 → MCP、LibreChat は Settings → MCP Servers、Replit は Integrations → MCP Servers、Zed は context_servers に、それぞれ rail.aiops.services/mcp を追加してください。

Each tool has its own configuration location. ChatGPT: Settings → Connectors / MCP. Claude Desktop: claude_desktop_config.json. Claude.ai: Account settings → Connectors. Cursor: cursor_mcp_config.json. Cline / Roo Code: mcpServers. Windsurf: mcp_config.json. Amazon Q Developer: ~/.aws/amazonq/mcp.json. Continue: .continue/mcpServers/mcp.json. Genspark: Settings → MCP. LibreChat: Settings → MCP Servers. Replit: Integrations → MCP Servers. Zed: context_servers. In each case, add rail.aiops.services/mcp as the server URL.

プラン・価格Plans & Pricing
日本円の価格は固定ですか?Is the Japanese yen price fixed?

日本円価格は本日レートでの概算価格です。請求通貨と最終金額はStripe Checkoutの表示をご確認ください。

The yen price is an estimate based on today's exchange rate. The billing currency and final amount are confirmed on the Stripe Checkout screen.

無料プランに制限はありますか?Are there limits on the free plan?

FREEプランは監視件数・頼度・機能に上限があります。本格運用にはスターター以上をご検討ください。

The FREE plan has limits on the number of monitors, check frequency, and features. We recommend the Starter plan or above for serious use.

プランを後から変更できますか?Can I change my plan later?

はい。アップグレード・ダウングレードともに対応しています。

Yes. Both upgrades and downgrades are supported.

AIOps Liveの有償プランでRailやClawも使えますか?Can I use Rail or Claw with a paid AIOps Live plan?

はい。AIOps Liveの有償サブスクリプションでは、RailおよびClawが無制限で利用できます。

Yes. Paid AIOps Live subscriptions include the basic features of Rail and Claw.

スコア・指標Scores & Metrics
Tech Health スコアとは何ですか?What is the Tech Health score?

可用性75%・P95レイテンシー15%・平均応答時間7%・安定性3%の複合スコア。90以上が良好、50未満は緊急対応。

A composite score calculated from availability (75%), P95 latency (15%), average response time (7%), and stability (3%).

Clarity スコアとは何ですか?What is the Clarity score?

アクセシビリティ・SSL/TLS・robots.txt・メタタグ・応答速度を合わせたUX/ガバナンス観点の指標。

A composite score of visibility factors including accessibility, SSL/TLS, robots.txt, meta tags, and response speed.

Focus Budget とは何ですか?What is Focus Budget?

Tech Healthから未解決インシデントのペナルティを差し引いた「対応可能リソース残量」の指標。

An indicator of 'available capacity' derived by subtracting unresolved incident penalties from Tech Health.

Gov スコアとは何ですか?What is the Gov score?

AIガバナンスチェックによる準拠状況の0~100評価。SSL・robots.txt・メタタグ等を評価。

A 0–100 evaluation of compliance based on AI governance checks, automatically inspecting SSL, robots.txt, meta tags, and more.

低下・正常・危険の違いは?What is the difference between Degraded, Normal, and Critical?

500ms未満=正常、500ms~2,000ms=低下、2,000ms以上またはHTTPエラー=危険。

Under 500ms = Normal, 500ms–2,000ms = Degraded, 2,000ms or above or HTTP error = Critical.

P95 レイテンシーとは何ですか?What is P95 latency?

計測値の下位95%に位置する応答時間。外れ値を除いた実際のユーザー体験に近い遅延指標。

The response time at the 95th percentile of measurements, closely reflecting actual user experience by excluding outliers.

スロット(Slot)とは何ですか?What is a Slot?

登録できる監視対象の框数。フリー5・Starter15・Growth50スロット。

The number of monitoring targets that can be registered. Free: 5, Starter: 15, Growth: 50 slots.

ワークスペース(Workspace)とは何ですか?What is a Workspace?

サービスをグループ化する管理単位。グロース以上で複数ワークスペース対応。

A management unit for grouping services. Multiple workspaces are available on the Growth plan and above.

AI診断はどのタイミングで実行されますか?When is AI diagnostics triggered?

フリーは月:10回まで自動、スターター以上は手動トリガーも可能。

Free: up to 10 times per month automatically. Starter and above also support manual triggers.

MCP連携とは何ですか?What is MCP integration?

MCP対応 AIツールとAPI直接連携。グロース以上で読み取りAPI、スケール以上でフルAPI・MCP Viewer。

Direct API integration with MCP-compatible AI tools. Read API available from Growth, full integration from Scale.

研究・根拠Research & Evidence
研究はどのような内容ですか?What is covered in the Research section?

AIオペレーション・サイバーセキュリティリスク・サプライチェーン分析に関する実証研究をもとに、サービス設計の根拠を公開しています。

Empirical research on AI operations, cybersecurity risk, and supply chain analysis.

研究の査読・公開状況はどうですか?What is the review and publication status of the research?

一部は進行中の研究です。公開済のものはResearchページに掛載しており、随時更新しています。

Some research is ongoing. Published work is listed on the Research page and updated regularly.

研究
Research

技術的背景や信頼性の考え方を、研究ページで公開しています

Explore the technical background and reliability rationale on our Research page

Live の設計背景、監視の意義、技術的な裏付けを確認したい方は 研究ページ をご覧ください。

For those who want to understand the design rationale behind Live, the significance of monitoring, and the technical basis, please visit our Research page.